Grating coupler
SiFab contains two grating couplers:
GratingCoupler: a fiber grating coupler with fully customisable layout.
FC_TE_1550: a fiber grating coupler optimized for operation at 1550 nm.
FC_TE_1300: a fiber grating coupler optimized for operation at 1300 nm.
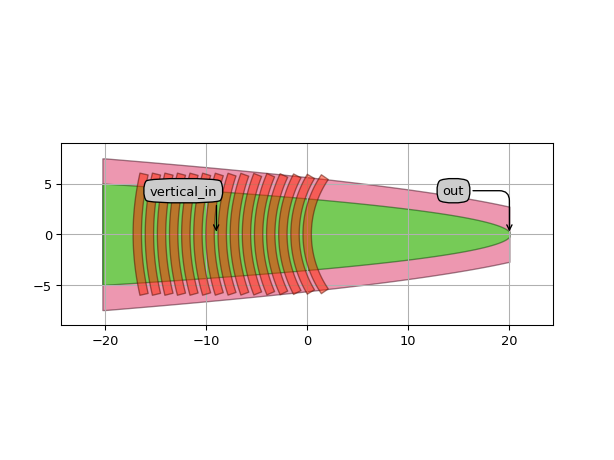
GratingCoupler
This is a grating coupler with fully customisable layout.
The GratingCoupler PCell is built hierarchically with two instances: one from Socket and one from Grating.
The socket contains the waveguide elements and the related properties.
It also contains information about the in-plane port.
The grating is parameterized, so users can specify e.g. grating period, line width, line length, number of periods, and curvature.
Reference
Click on the name of the component below to see the complete PCell reference.
Generic grating coupler PCell that has a grating and a socket child cell. |
Example
from si_fab import all as si_fab
from ipkiss3 import all as i3  # noqa: F401


fc = si_fab.GratingCoupler(
    line_width=0.83,
    period=1.2,
    n_o_periods=15,
)
fc_lo = fc.Layout()

fc_lo.visualize(annotate=True)
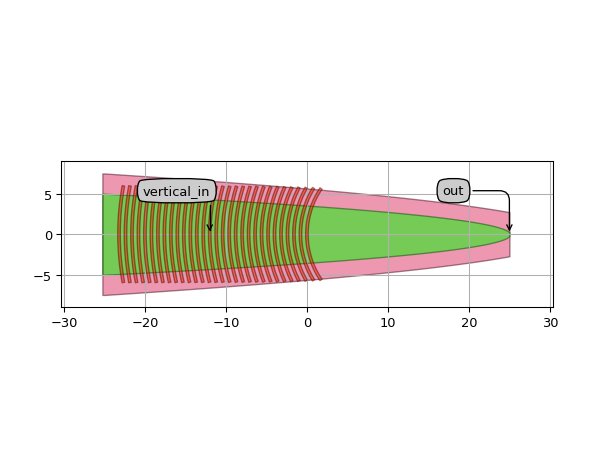
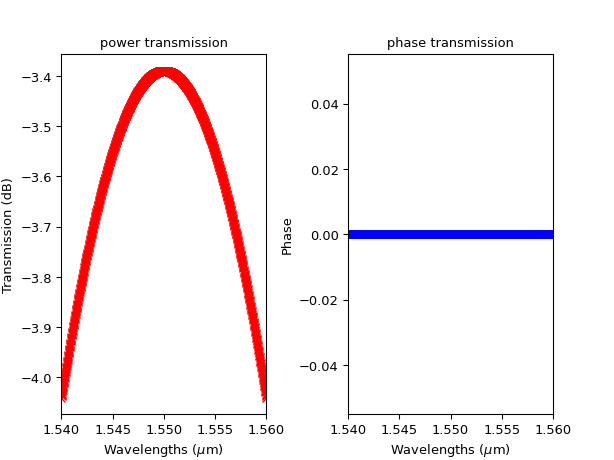
FC_TE_1550
This is a specialization of the generic GratingCoupler PCell.
This component has locked properties and has been optimized for 1550 nm wavelength.
Reference
Click on the name of the component below to see the complete PCell reference.
Grating coupler for 1550 nm. |
Example
from si_fab import all as si_fab
from ipkiss3 import all as i3
import numpy as np
import matplotlib.pyplot as plt

fc = si_fab.FC_TE_1550()
fc_lv = fc.Layout()
fc_lv.visualize(annotate=True)

fc_cm = fc.CircuitModel()

wavelengths = np.linspace(1.54, 1.56, 1000)
S = fc_cm.get_smatrix(wavelengths=wavelengths)
plt.figure()
plt.subplot(121)
plt.plot(wavelengths, i3.signal_power_dB(S["out", "vertical_in"]), "rx-")
plt.xlabel("Wavelengths ($\\mu$m)")
plt.ylabel("Transmission (dB)")
plt.title("power transmission")
plt.xlim([wavelengths[0], wavelengths[-1]])
plt.subplot(122)
plt.plot(wavelengths, np.angle(S["out", "vertical_in"]), "bx-")
plt.xlabel("Wavelengths ($\\mu$m)")
plt.ylabel("Phase")
plt.title("phase transmission")
plt.xlim([wavelengths[0], wavelengths[-1]])
plt.show()
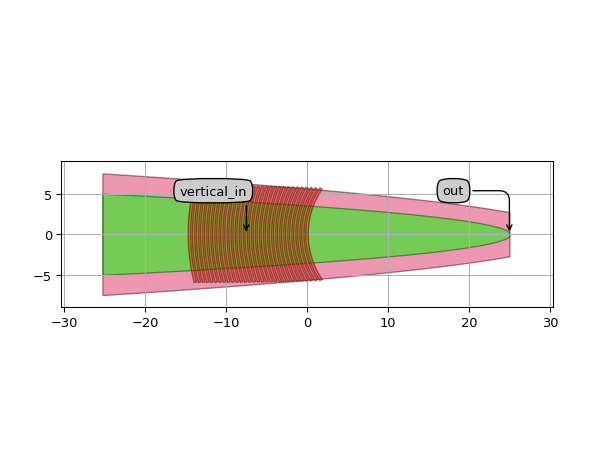
FC_TE_1300
This is a specialization of the generic GratingCoupler PCell.
This component has locked properties and has been optimized for 1300 nm wavelength.
Reference
Click on the name of the component below to see the complete PCell reference.
Grating coupler for 1300 nm. |
Example
from si_fab import all as si_fab
from ipkiss3 import all as i3
import numpy as np
import matplotlib.pyplot as plt
fc = si_fab.FC_TE_1300()
fc_lv = fc.Layout()
fc_lv.visualize(annotate=True)
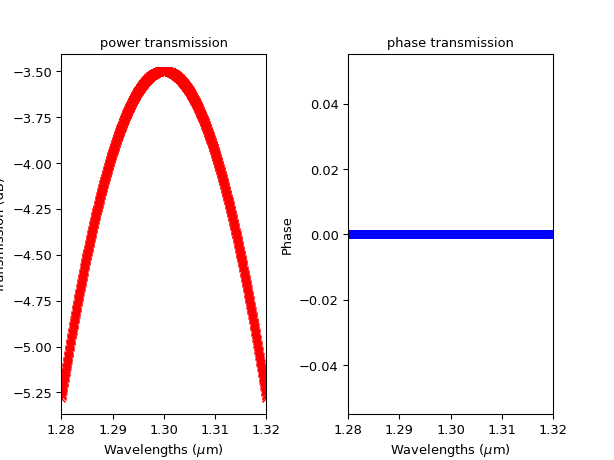
fc_cm = fc.CircuitModel()
wavelengths = np.linspace(1.28, 1.32, 1000)
S = fc_cm.get_smatrix(wavelengths=wavelengths)
plt.figure()
plt.subplot(121)
plt.plot(wavelengths, i3.signal_power_dB(S["out", "vertical_in"]), "rx-")
plt.xlabel("Wavelengths ($\\mu$m)")
plt.ylabel("Transmission (dB)")
plt.title("power transmission")
plt.xlim([wavelengths[0], wavelengths[-1]])
plt.subplot(122)
plt.plot(wavelengths, np.angle(S["out", "vertical_in"]), "bx-")
plt.xlabel("Wavelengths ($\\mu$m)")
plt.ylabel("Phase")
plt.title("phase transmission")
plt.xlim([wavelengths[0], wavelengths[-1]])
plt.show()