Waveguide bends
SiFab contains two predefined waveguide bends that can be used in fixed bend waveguides:
WaveguideBend: a parametric 90-degree waveguide bend.
EulerFixedBend: an Euler bend with fixed properties that has been pre-simulated using Ansys Lumerical FDTD.
WaveguideBend
This is a 90-degree waveguide bend that is parametric to the trace template, bend size, bend radius and rounding algorithm.
The trace template of the waveguide is provided by the trace_template property.
The size of the bend (i.e. the distance between the corner and the ports) is provided by the bend_size property.
The path that the waveguide takes is then calculated using the parameters bend_radius and rounding_algorithm which are the maximum bend radius and the rounding algorithm of the bend, respectively.
By default, the circuit model is not implemented.
Reference
Click on the name of the component below to see the complete PCell reference.
A 90-degree waveguide bend. |
Example
from si_fab import all as pdk
from ipkiss3 import all as i3
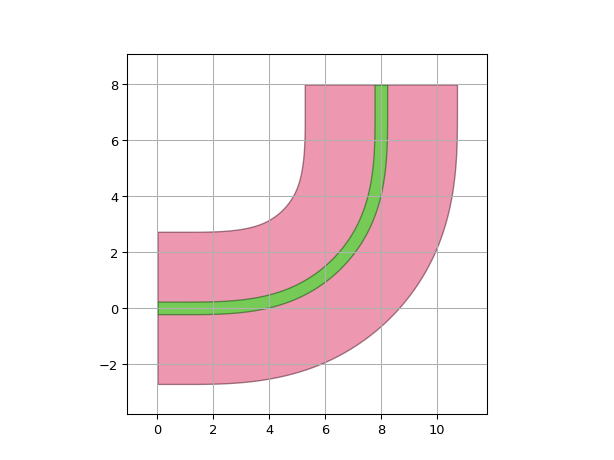
bend = pdk.WaveguideBend(trace_template=pdk.SiWireWaveguideTemplate())
bend_lv = bend.Layout(bend_size=10, bend_radius=5, rounding_algorithm=i3.SplineRoundingAlgorithm())
bend_lv.visualize()
Simulation
Stand-alone simulations of the WaveguideBend PCell can be performed by applying the simulation recipe of the waveguide bend on a parametric layout.
Usually, this is done to calculate the bending losses of the waveguide, or to optimize it.
As simulations can take time to complete, it is best to organise and save all the simulation results in one folder for later inspection.
This allows to run long simulations once and process the data later.
Reference
Click on the name of the function below to see the complete PCell reference.
|
This function simulates a waveguide bend using Luceda Link for Ansys Lumerical FDTD and returns an s-matrix. |
Example
from si_fab import all as pdk
from si_fab.components.fixed_bend.simulation.simulate_lumerical import simulate_bend
from ipkiss3 import all as i3
from ipkiss3.simulation.circuit.utils import convert_smatrix_units
import os
import pylab as plt
inspect = False # Inspect the simulation
resimulate = True # Resimulate
plot = True # Plot the simulation result
wl_start = 1.5
wl_end = 1.6
n_points = 100
length = 5.0
project_folder = "./waveguide_bend_sim" # Name of the project
smatrix_path = os.path.join(project_folder, "smatrix.s2p") # Path where the smatrix is saved
if not os.path.exists(project_folder):
os.mkdir(project_folder)
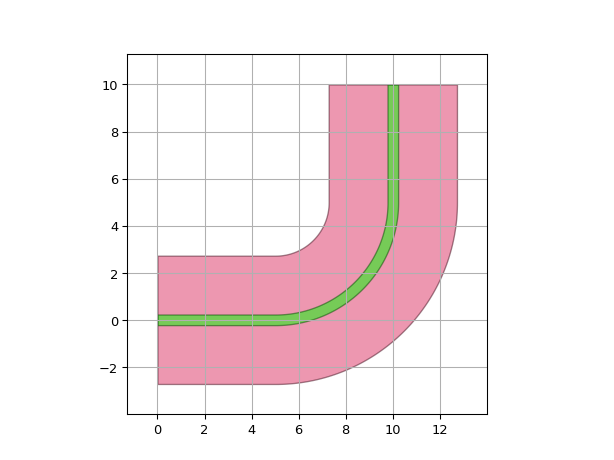
bend = pdk.WaveguideBend()
bend_lv = bend.Layout(bend_size=10, bend_radius=5, rounding_algorithm=i3.SplineRoundingAlgorithm())
fig = bend_lv.visualize()
fig.savefig(
os.path.join(project_folder, "waveguide_bend_layout.png"),
transparent=True,
bbox_inches="tight",
)
if resimulate:
smatrix = simulate_bend(
layout=bend_lv,
project_folder=project_folder,
mesh_accuracy=3,
wavelengths=(wl_start, wl_end, n_points),
inspect=inspect,
)
smatrix.to_touchstone(smatrix_path)
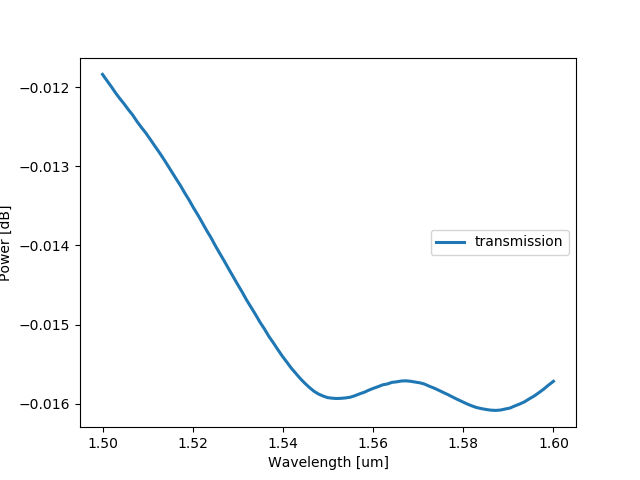
if plot:
smatrix = convert_smatrix_units(
i3.device_sim.SMatrix1DSweep.from_touchstone(smatrix_path),
to_unit="um",
)
wavelengths = smatrix.sweep_parameter_values
plt.figure()
plt.plot(wavelengths, i3.signal_power_dB(smatrix["out", "in"]), label="transmission", linewidth=2.2)
plt.xlabel("Wavelength [um]")
plt.ylabel("Power [dB]")
plt.legend(loc=5)
plt.savefig(os.path.join(project_folder, "model.png"), transparent=True)
EulerFixedBend
EulerFixedBend is a pre-simulated component with locked properties. The simulated transmission and phase is used by the circuit model to run Caphe simulations.
Reference
Click on the name of the component below to see the complete PCell reference.
A fixed cell for an Euler bend |
Example
import si_fab.all as pdk
import ipkiss3.all as i3
import numpy as np
from matplotlib import pyplot as plt
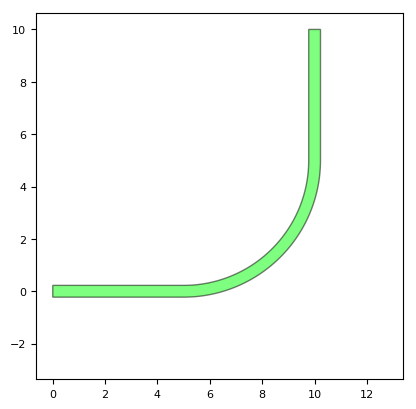
bend = pdk.EulerFixedBend()
bend_lv = bend.Layout()
bend_lv.visualize()
mmi_cm = bend.CircuitModel()
wavelengths = np.linspace(1.5, 1.6, 51)
S = mmi_cm.get_smatrix(wavelengths=wavelengths)
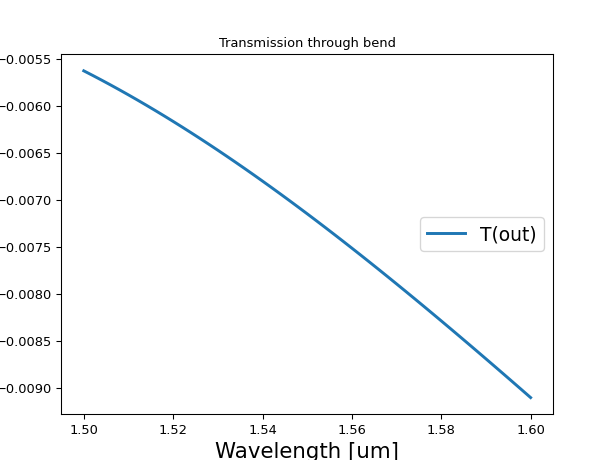
plt.figure()
plt.title("Transmission through bend")
plt.plot(wavelengths, i3.signal_power_dB(S["out", "in"]), "-", linewidth=2.2, label="T(out)")
plt.xlabel("Wavelength [um]", fontsize=16)
plt.ylabel("Transmission [dB]", fontsize=16)
plt.legend(fontsize=14, loc=5)
plt.show()