Waveguide crossing
SiFab contains two waveguide crossing components:
Crossing: a parametric waveguide crossing.
CrossingOptimized: an optimized waveguide crossing with fixed properties, that has been pre-simulated using Ansys Lumerical FDTD.
Crossing
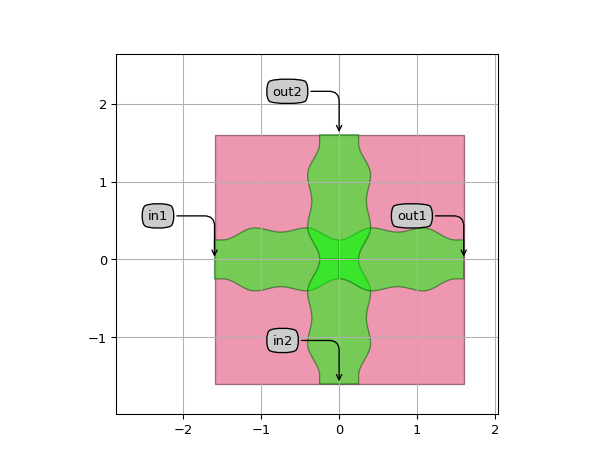
This crossing is completely parametric and builds up from splines with equidistant waypoints, separated by an amount given by the parameter segment_length.
The height of the way-points is determined by the parameter widths.
The crossing is calculated to be completely symmetric along the X and the Y axes.
This parametric crossing has no circuit model.
Reference
Click on the name of the component below to see the complete PCell reference.
Low-loss waveguide crossing. |
Example
from si_fab import all as pdk

# Parametric Crossing
crossing = pdk.Crossing(
    name="Crossing",
    widths=[0.5, 0.8, 0.7, 0.8, 0.5],
    segment_length=0.375,
    min_straight=0.1,
    discretisation=0.01,
)

crossing_lv = crossing.Layout()
crossing_lv.visualize(annotate=True)
Simulation
Stand-alone simulations of the Crossing PCell can be performed by applying the simulation recipe of the crossing on a parametric layout.
Usually, this is done to explore the component behaviour when the parameters are changed, or to optimize it.
As simulations can take time to complete, it is best to organise and save all the simulation results in one folder for later inspection.
This allows to run long simulations once and process the data later.
Reference
Click on the name of the function below to see the complete PCell reference.
|
Simulates a crossing with Lumerical and returns an smatrix. |
Example
import si_fab.all as pdk
from si_fab.components.crossing.simulation.simulate_lumerical import simulate_crossing
from ipkiss3 import all as i3
from ipkiss3.simulation.circuit.utils import convert_smatrix_units
import os
inspect = False # Inspect the simulation
resimulate = True # Re-simulate
plot = True # Plot the simulation result
project_folder = "./crossing_sim" # Name of the project
smatrix_path = os.path.join(project_folder, "smatrix.s4p") # Path where the smatrix is saved
if not os.path.exists(project_folder):
os.mkdir(project_folder)
cell = pdk.Crossing(name="Crossing")
lv = cell.Layout()
fig = lv.visualize(annotate=True, show=False)
fig.savefig(
os.path.join(project_folder, "crossing_sim_layout.png"),
transparent=True,
bbox_inches="tight",
)
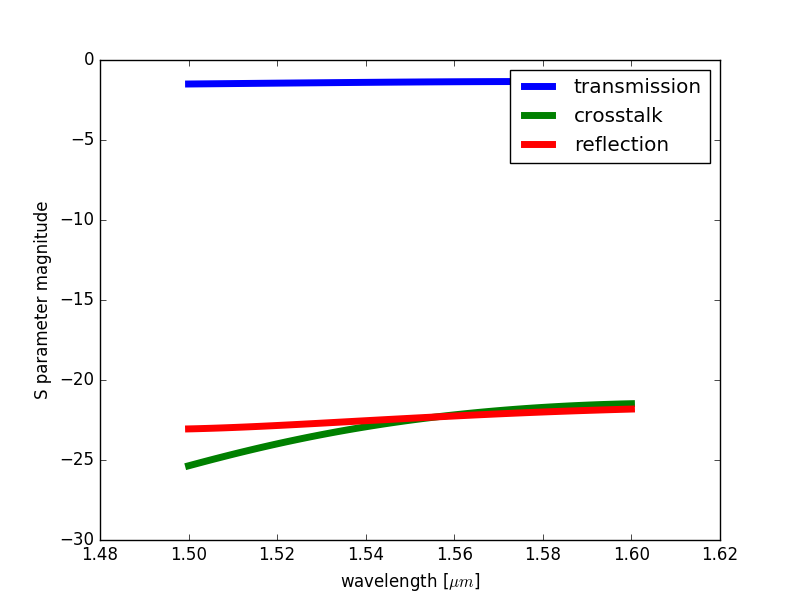
# Note that the simulated results are artificial results as they're based on fictional technology
# and components. They only serve demonstration purposes.
if resimulate:
smatrix = simulate_crossing(
layout=lv,
project_folder=project_folder,
inspect=inspect,
)
smatrix.to_touchstone(smatrix_path)
if plot:
smatrix = convert_smatrix_units(
i3.device_sim.SMatrix1DSweep.from_touchstone(smatrix_path),
to_unit="um",
)
smatrix.visualize(
term_pairs=[
("in1", "out1"), # transmission
("in2", "out1"), # crosstalk
("in1", "in1"), # reflection
],
scale="dB",
show=False,
save_name=os.path.join(project_folder, "model.png"),
)
CrossingOptimized
CrossingOptimized is a pre-simulated component with locked properties. The simulated S-matrix is used by the circuit model to run Caphe simulations.
Reference
Click on the name of the component below to see the complete PCell reference.
Optimized low-loss waveguide crossing. |
Example
from si_fab import all as pdk
import numpy as np
# Optimized Crossing
crossing = pdk.CrossingOptimized()
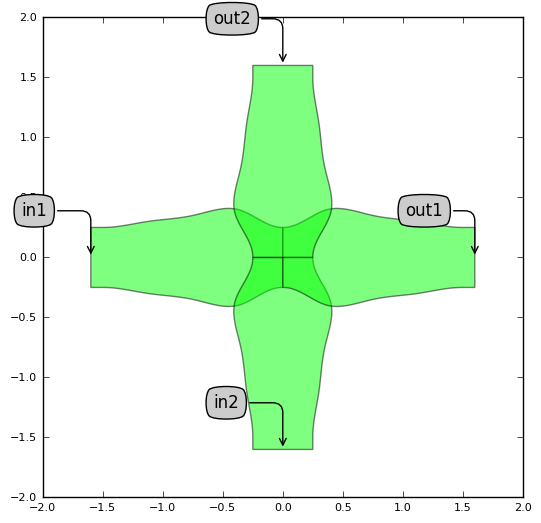
# Layout
crossing_lv = crossing.Layout()
crossing_lv.write_gdsii("crossing.gds")
crossing_lv.visualize(annotate=True)
# Circuit simulation
crossing_cm = crossing.CircuitModel()
wavelengths_sim = np.linspace(1.50, 1.6, 1000)
smat = crossing_cm.get_smatrix(wavelengths=wavelengths_sim)
smat.visualize(
term_pairs=[
("in1", "out1"), # transmission
("in2", "out1"), # crosstalk
("in1", "in1"), # reflection
],
title="Optimized Crossing",
scale="dB",
)

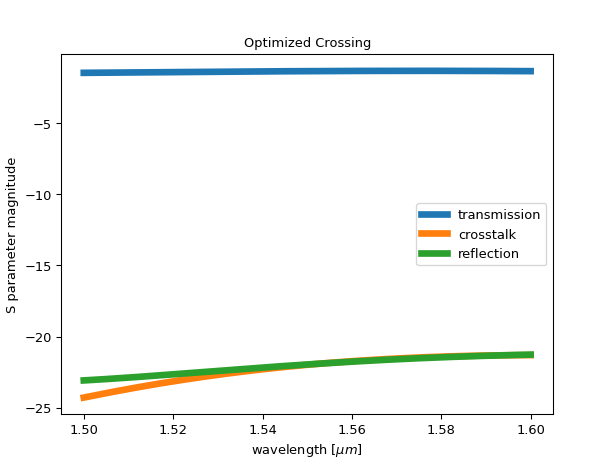
Note
The above simulation results are artificial results as they’re based on fictional technology and components. These only serve demonstration purposes.