Setting up the editor environment in Wing IDE
As an alternative to PyCharm, you can also use Wing IDE. To install Wing IDE, please go to https://wingware.com/downloads/wingide to download a copy. After installation, you get the fully functional product running on a time-limited license, with up to three 10-day trial period.
Creating a new project and choosing the python executable
Note
If you want, you can skip the instructions below and directly open the sample project. The sample project can be accessed by clicking the sample button in Luceda Control Center. This opens a folder. In this folder, there is a wing project samples.wpr. Opening this file will start Wing IDE with the correct Python interpreter, and the samples folder is added to the project. Once you create a new project, you have to go through the steps below.
We start by creating a new project and choosing the correct Python interpreter (see figure starting a new project). Choose . For the Python executable, choose custom, and select envs\ipkiss3\python.exe from your installation.
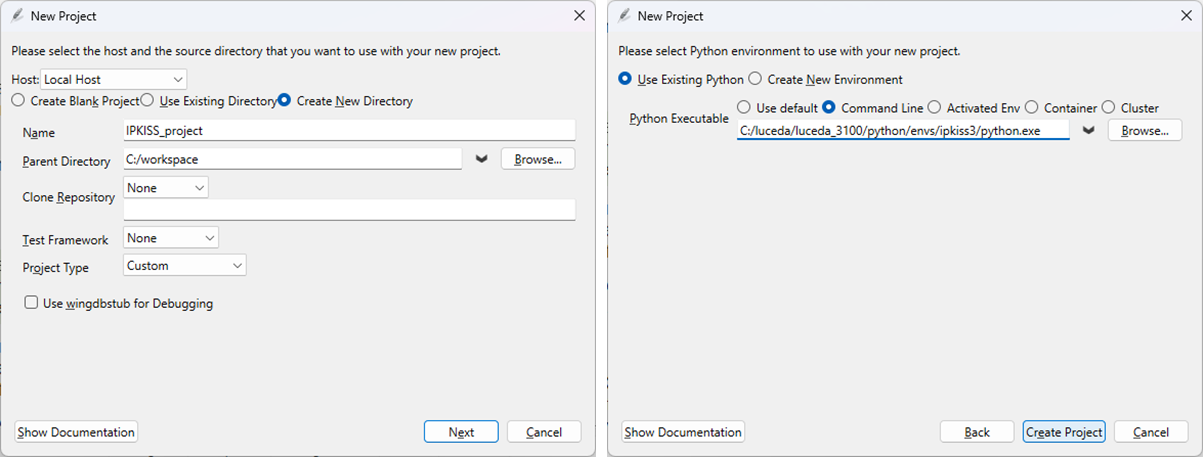
Starting a project in Wing IDE and choosing the correct Python interpreter.
Then we start a new project in Wing IDE. Make sure you choose the correct Python interpreter. The python interpreter (python.exe) is the main program that runs all the IPKISS scripts that you create. For each created environment (remember, by default, the environment ipkiss3 is created), a new Python executable is created (note: do not use pythonw.exe. pythonw.exe is used to start up windowed applications, in order to suppress the console).
After pressing OK, you are asked to save the project file now or later. We suggest to save it immediately, and store it on a working location where you wish to work with IPKISS, e.g., C:\users\username\Documents\luceda\ipkisstest.
You can now create a new file by selecting , type in print(“Hello World”), and save it as hello.py in the working location (this is shown in the next step, too).
The editor environment
The Wing IDE environment looks like the figure below (depending on the exact version of the software, there might be minor differences). The most important tabs and windows are annotated:
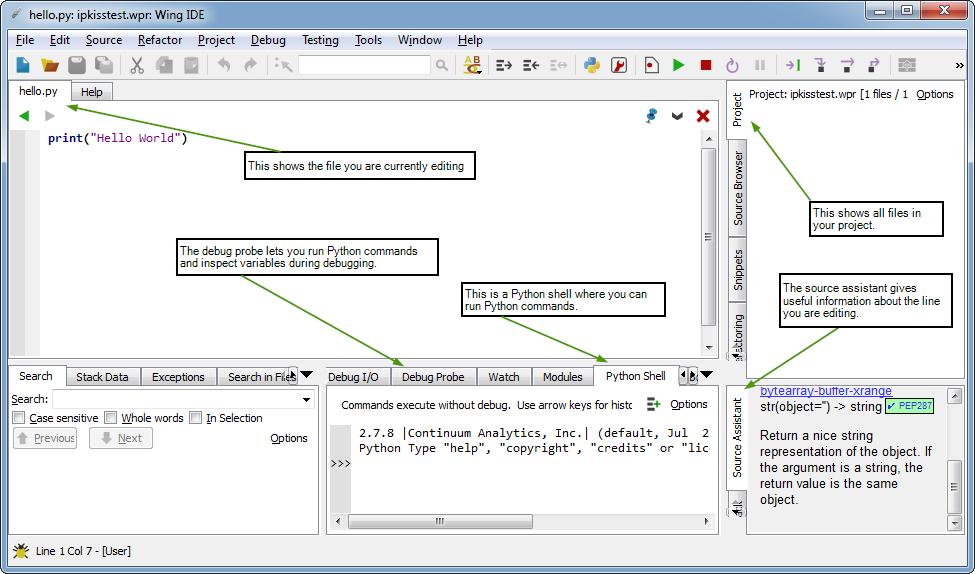
When you open Wing IDE for the first time, it looks like this. Important windows have been annotated.
One important additional step is setting the PATH variable. We need to add two paths here, one is Scripts\, the other one is Library\mingw-w64\bin. To do this, go to , and choose Add to inherited environment. Now you can set the PATH.
Please change C:\luceda\luceda_2026030rc1 to the location where you installed IPKISS. This is also shown in figure setting the PATH:
PATH=C:\luceda\luceda_[VERSION]\python\envs\ipkiss3\Scripts;C:\luceda\luceda_[VERSION]\python\envs\ipkiss3\Library\mingw-w64\bin;${PATH}
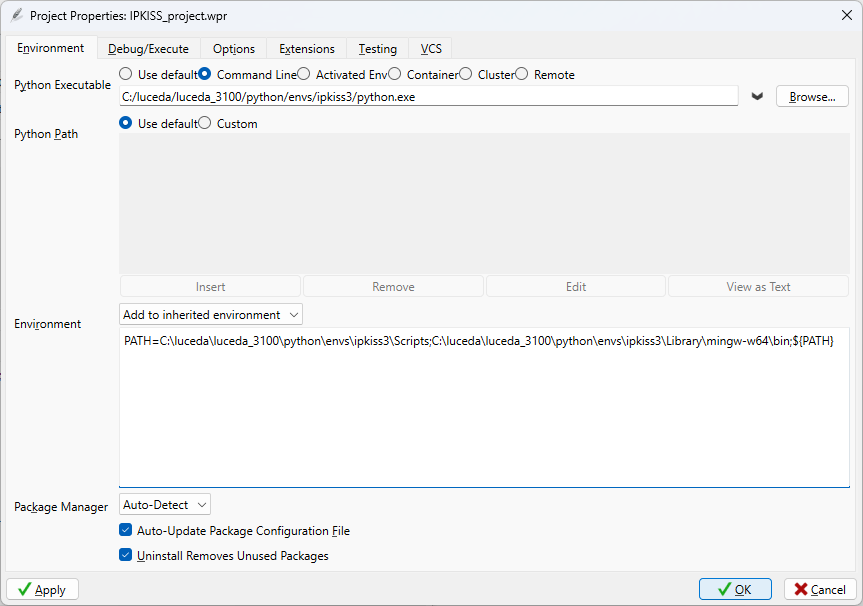
Set PATH by going to . In Environment, choose: Add to inherited environment, and set PATH as shown.
Before we start creating additional files, it is important to add a folder to the project. This is explained in the next step.
Adding a folder to the project
Currently, no file or folder is added to your project. Adding a folder ensures that you can easily browse through the project files by using the project tab on the right. To add a folder, right-click inside the project pane, and press Add Existing Directory…. Then, choose the folder you wish to add to the project, and choose which files are included in the project (e.g., all files, only Python files, …):
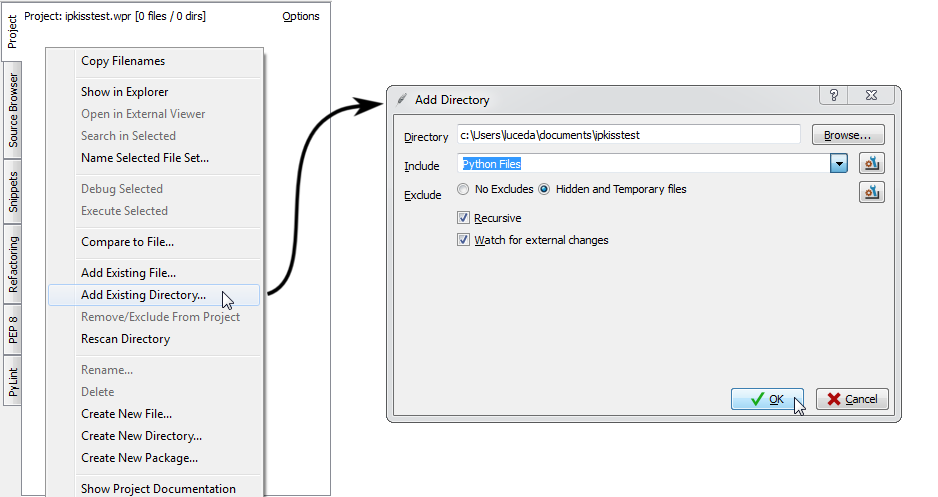
In the project tab, right-click and press Add Existing Directory. Add your project directory to the project.
After adding the directory to the project, new files and folders that are created will automatically show up in the Project tab.
Executing your first file
Note that by adding the folder to your project, the hello.py should show up in the project pane (make sure it is saved in the correct location). Now there are two ways to run a file in Python: by executing it, or by debugging it.
To execute a file, go to .
To debug a file, go to (alternatively, press F5, or press the green play button
 ).
).
Go ahead and execute the current file. If you execute the file, the output of the program will be written to the OS Commands pane:
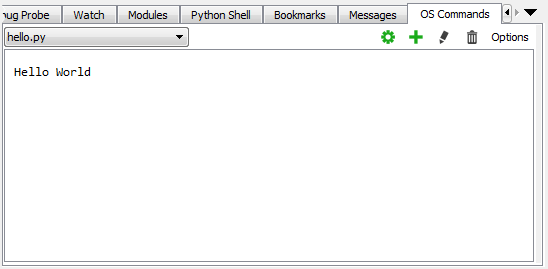
In the OS Commands pane, you will see the output of the file after executing it.
Now we quickly demonstrate how to debug a file. To illustrate this, we add a few lines, and add a breakpoint in the code. We then start debugging. The program is paused at the breakpoint location:
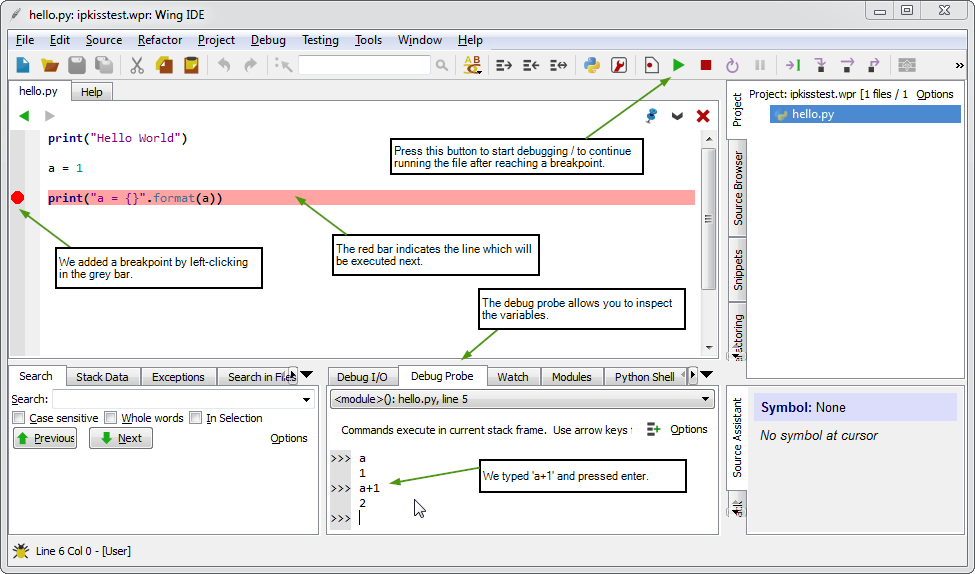
Wing IDE in debug mode: you can inspect variables in the Debug Probe tab.
From the breakpoint location, you can check the content of each variable, or run additional Python commands. Pressing the button will continue code execution.
Debugging a file goes slower than executing the file. However, when an error occurs in your program, the debugger logs the state of the program at the location where the error occurs. It allows the user to inspect variables and run additional commands to find out the source of the error. Hence, it is a very useful way to find errors in your code. In production, you are more likely to execute the file which is faster.
Note
Debugging is a very powerful way to quickly find errors in your code / design, and to inspect your variables. Additional information, including tutorial videos, can be found here.