GC1
- class ipkiss3.cml.GC1
Model for a grating coupler.
The inclination and angle of the port should match the direction of peak transmission at the center wavelength, when light is incident from the vertical (through vertical_in) and couples to the out port
             *  "vertical_in"
              *
               *
inclination   / *
            _/  _*  _   _
     "in" _| |_| |_| |_| |_  ---> "out"
- Parameters:
- peak_transmission: float
Peak transmission of the coupler (in amplitude).
- bandwidth_3dB: float
3 dB bandwidth of the transmission.
- center_wavelength: float (m)
Wavelength around which the transmission is centered.
- reflection_vertical_in: complex
Complex-valued reflection at the vertical_in port.
- reflection: complex
Complex-valued reflection at the out port.
Notes
The insertion loss follows a gaussian profile (a parabolic profile in dB) and is minimal at the center wavelength of the grating:
\[\alpha_{gc1}(\lambda) = \exp\left(-\frac{\left(\lambda-\lambda_c\right)^2}{2\sigma^2}\right)\]where \(\lambda_c\) or \(\texttt{center_wavelength}\) is the central wavelength, at which the insertion loss is minimal (quantified by \(\texttt{peak_transmission}\)), and where \(\sigma\) is the 3 dB bandwidth (\(\texttt{bandwidth_3dB}\)) of the grating coupler divided by 2.35482. \(\lambda\) in the equation above is governed by \(\texttt{env.wavelength}\). The model also takes into account the wavelength independent reflections (for optical amplitude) at the grating ports, which are quantified by \(\texttt{reflection}\) and \(\texttt{reflection_vertical_in}\).
Terms
Term Name
Type
#modes
vertical_in
Optical
1
out
Optical
1
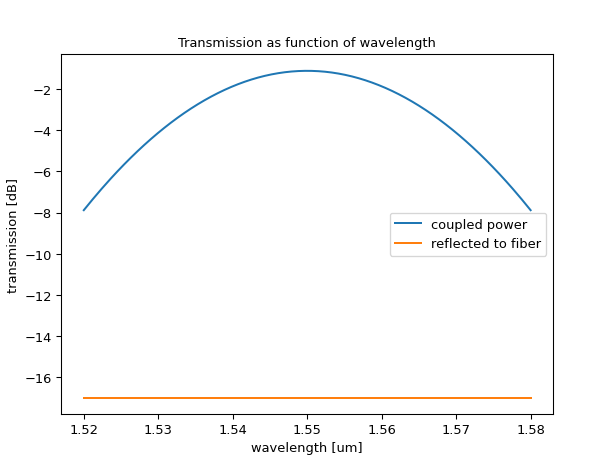
Examples
import numpy as np
import ipkiss3.all as i3
import matplotlib.pyplot as plt

model = i3.cml.GC1(
    peak_transmission=np.sqrt(0.6),
    bandwidth_3dB=0.040,
    center_wavelength=1.55e-6,
    reflection=np.sqrt(0.01) * 1j,
    reflection_vertical_in=np.sqrt(0.02) * 1j,
)

wavelengths = np.linspace(1.52, 1.58, 201)
S = i3.circuit_sim.test_circuitmodel(model, wavelengths)

through = 10 * np.log10(np.abs(S["out", "vertical_in"]) ** 2)
fiber_reflection = 10 * np.log10(np.abs(S["vertical_in", "vertical_in"]) ** 2)

plt.figure()
plt.plot(wavelengths, through, label="coupled power")
plt.plot(wavelengths, fiber_reflection, label="reflected to fiber")
plt.xlabel("wavelength [um]")
plt.ylabel("transmission [dB]")
plt.legend()
plt.title("Transmission as function of wavelength")
plt.show()