AWG simulation and analysis
Simulation
At this point we have a complete AWG with a layout, a logical netlist and a simulation model.
We can now simply ask Caphe (Luceda IPKISS’ built-in circuit simulator) to calculate its S-parameters and save the results.
This is done by instantiating a circuit model and using CircuitModelView.get_smatrix as for any other circuit.
We also export the S-matrix to a Touchstone file so that we can inspect it afterwards.
print("Simulating AWG...")
awg_s = generated_awg_circuit.get_smatrix(simulation_wavelengths_awg)  # Note, fanout not simulated
smatrix_path = os.path.join(save_dir, f"smatrix.s{awg_s.data.shape[0]}p")
awg_s.to_touchstone(smatrix_path)
print(f"{smatrix_path} written")
Analysis
Next, we will take the S-matrix and check it against the figures of merit. We check the behaviour of the AWG according to the same specifications we defined at the top of the file.
We start by explicitly calculating the wavelengths of the different channels.
The helper function awg.frequency_to_wavelength defined in Luceda AWG Designer helps us convert these channels from frequency to wavelength domain.
# Calculate the frequencies of the different channels.
channel_half_span = channel_spacing * (n_channels - 1) / 2
channel_freq = np.linspace(center_frequency - channel_half_span, center_frequency + channel_half_span, n_channels)
channel_wav = awg.frequency_to_wavelength(channel_freq)

channel_width = 10e-4
output_ports = [f"out{p + 1}" for p in range(len(channel_wav))]

print("Analyzing AWG...")
Initialize the spectrum analyzer
The measurements are done using i3.SpectrumAnalyzer.
We initialize the spectrum analyzer with
the S-matrix data of the AWG,
the input port (or port:mode) to consider,
the output ports (or port:mode) which we want to analyze,
whether we want to analyze in dB scale (True) or linear (False),
and the threshold we set for deciding about peaks: -10 (dB) by default. We made this a parameter that you can define at the top of the file.
Measure key parameters
Now we use the spectrum analyzer to measure different properties of the AWG we want to validate against specifications:
The peak wavelengths
The channel widths
The (minimum) insertion loss within the channel
The nearest-neighbour crosstalk
The crosstalk from further neighbours (excluding nearest-neighbour contributions)
The 3dB passbands of the channels
print("Measuring Peaks...")
peaks = spec_analyzer.peaks()
peak_wavelengths = [peak["wavelength"][0] for peak in peaks.values()]
peak_error = np.abs(channel_wav - peak_wavelengths)

print("Measuring Crosstalk Bands...")
bands = spec_analyzer.width_passbands(channel_width)
insertion_loss = list(spec_analyzer.min_insertion_losses(bands=bands).values())
cross_talk_near = list(spec_analyzer.near_crosstalk(bands=bands).values())
cross_talk_far = list(spec_analyzer.far_crosstalk(bands=bands).values())
passbands_3dB = list(spec_analyzer.cutoff_passbands(cutoff=-3.0).values())
Plotting and report generation
Next, we write a report containing the analyzed specifications. For later reference, this is stored in a file.
report = dict()
band_values = list(bands.values())
for cnt, port in enumerate(output_ports):
    channel_report = {
        "peak_expected": channel_wav[cnt],
        "peak_simulated": peak_wavelengths[cnt],
        "peak_error": peak_error[cnt],
        "band": band_values[cnt][0],
        "insertion_loss": insertion_loss[cnt][0],
        "cross_talk": cross_talk_far[cnt] - insertion_loss[cnt][0],
        "cross_talk_nn": cross_talk_near[cnt] - insertion_loss[cnt][0],
        "passbands_3dB": passbands_3dB[cnt],
    }
    report[port] = channel_report


def serialize_ndarray(obj):
    return obj.tolist() if isinstance(obj, np.ndarray) else obj


report_path = os.path.join(save_dir, "report.json")

# open file for writing, "w"
with open(report_path, "w") as f:
    json.dump(report, f, sort_keys=True, default=serialize_ndarray, indent=0)
print(f"{report_path} written")
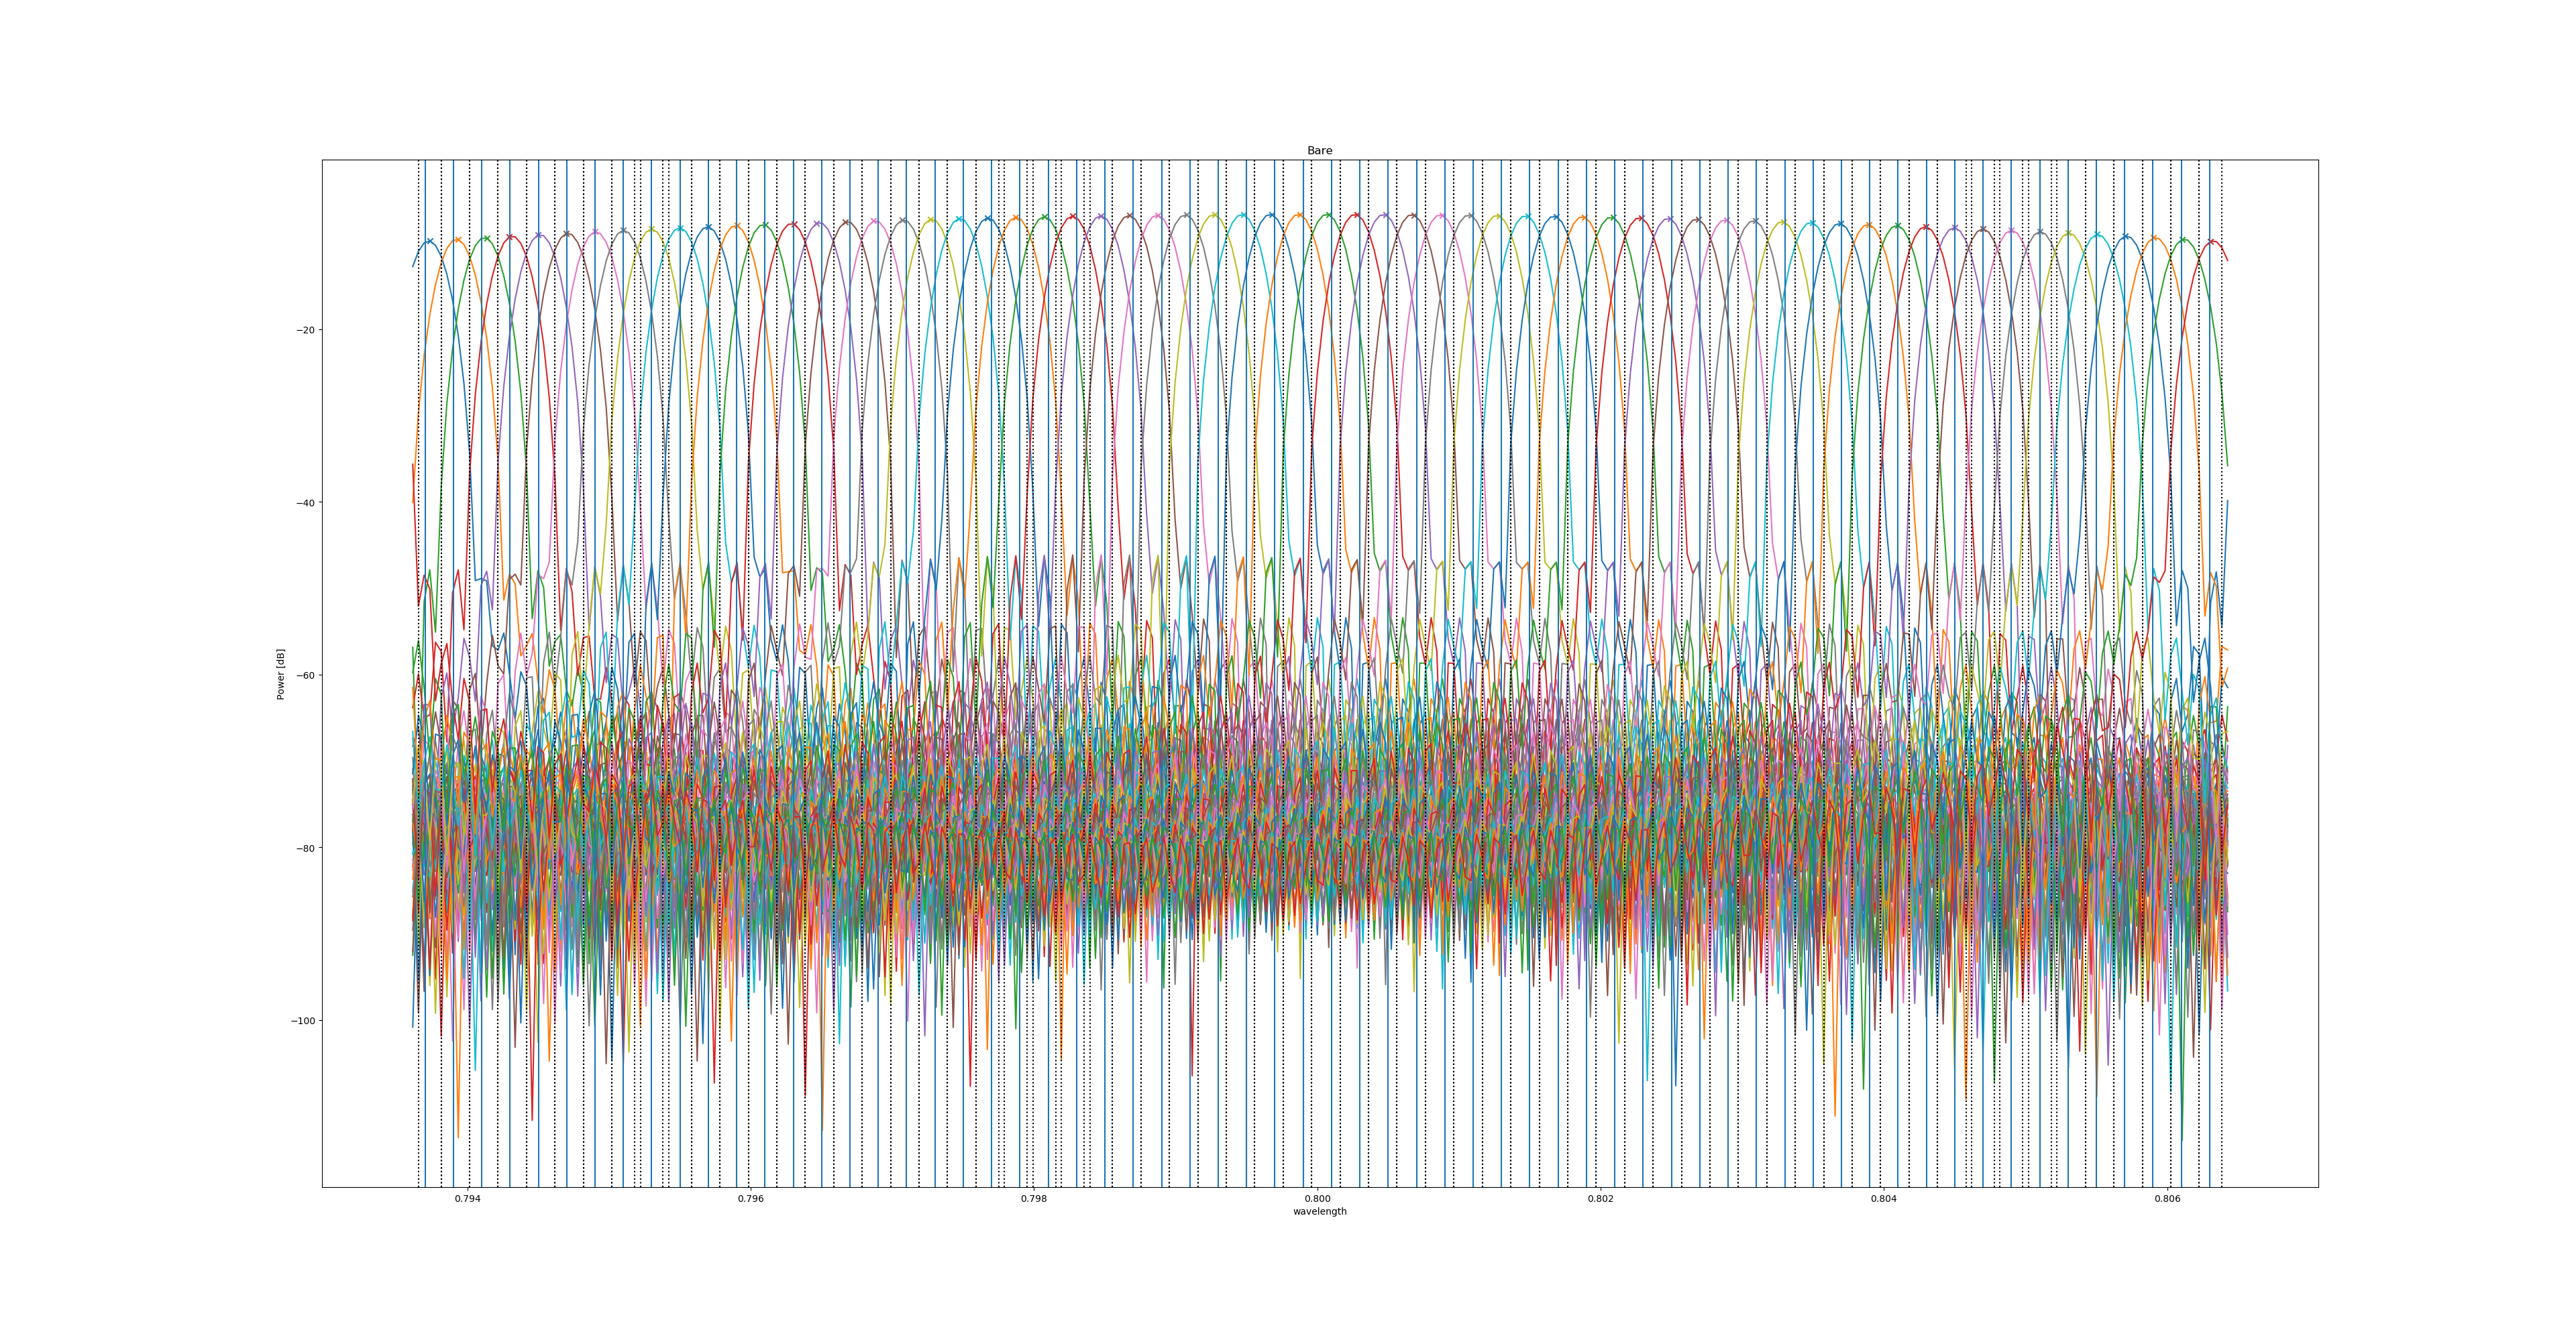
Finally, we plot the transmission spectrum and save it.
    print("Plotting Spectrum...")
    awg_s.visualize(
        title="Output spectrum of AWG",
        term_pairs=[
            ("in1", "out1"),
            ("in1", "out2"),
            ("in1", "out3"),
            ("in1", "out4"),
            ("in1", "out5"),
            ("in1", "out6"),
            ("in1", "out7"),
            ("in1", "out8"),
            ("in1", "out9"),
        ],
        scale="dB",
    )

Report JSON file: report_finalized.json