Visualizing Layouts
Once a LayoutView is created, you can visualize and inspect it using the Luceda Layout Visualizer via the .visualize() method, as shown below:
import si_fab.all as pdk
import ipkiss3.all as i3

mmi = pdk.MMI1x2Optimized1550()
mmi_layout = mmi.Layout()

mmi_layout.visualize()
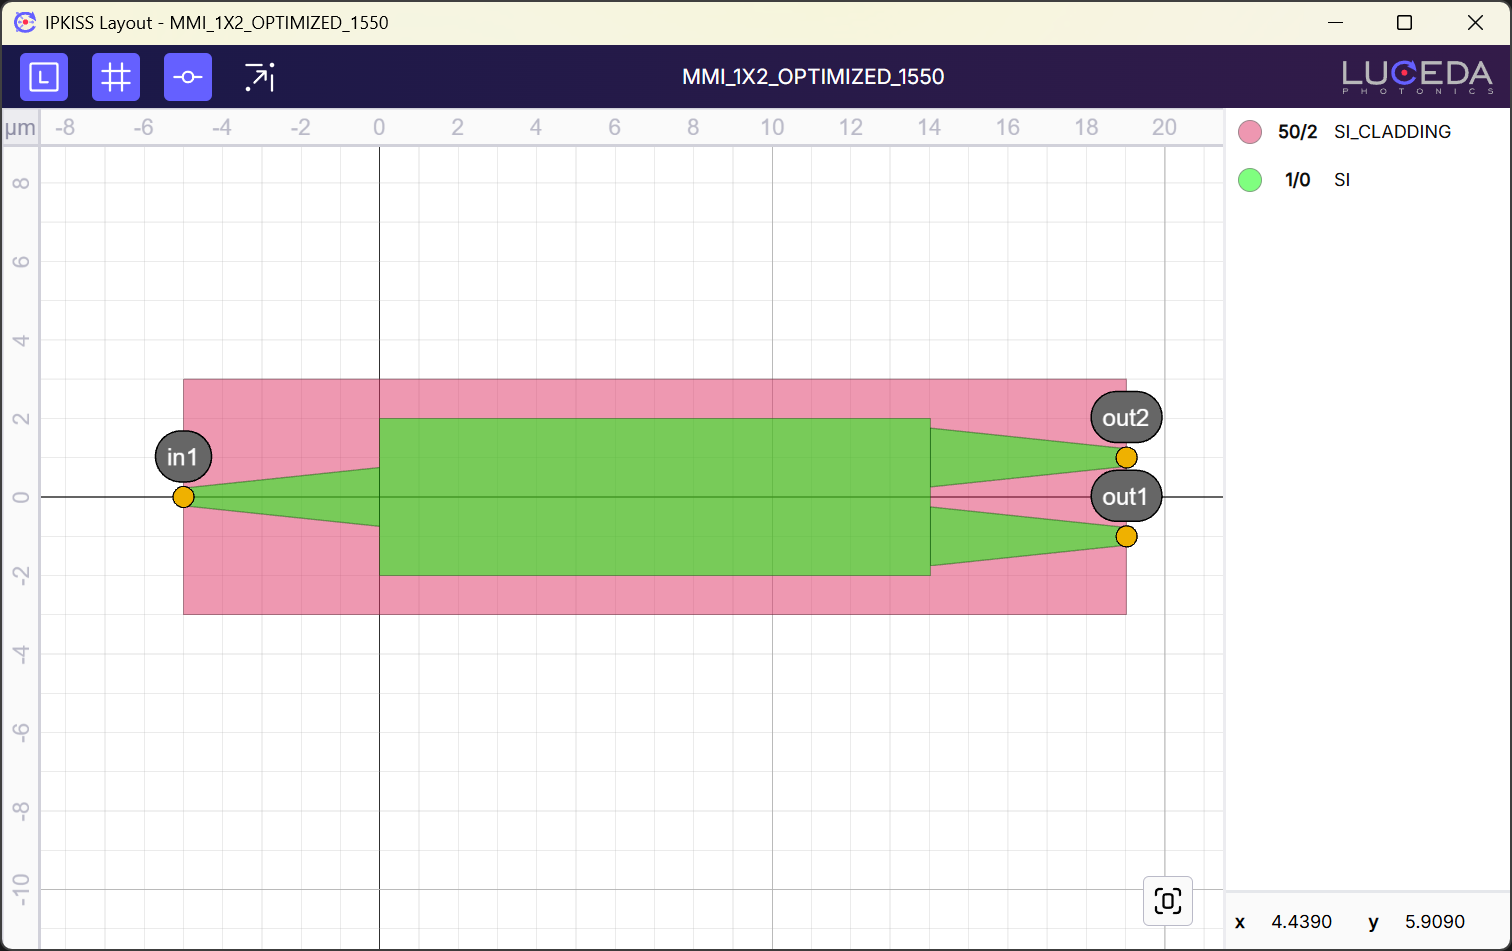
Within the Luceda Layout Visualizer, you can explore your layout and perform a range of actions, such as
toggling labels, the grid, and port labels
snapping the layout to the grid
hiding or showing layers
clicking instances in the top cell to view their ports and instance names
copy port names and instance names by double clicking their labels
The .visualize() method accepts several parameters (see visualize) that were previously used to customize the layout display in the earlier matplotlib-based visualizer.
These parameters have no effect in the newer Luceda Layout Visualizer, since layout display customization is now handled directly through the GUI.
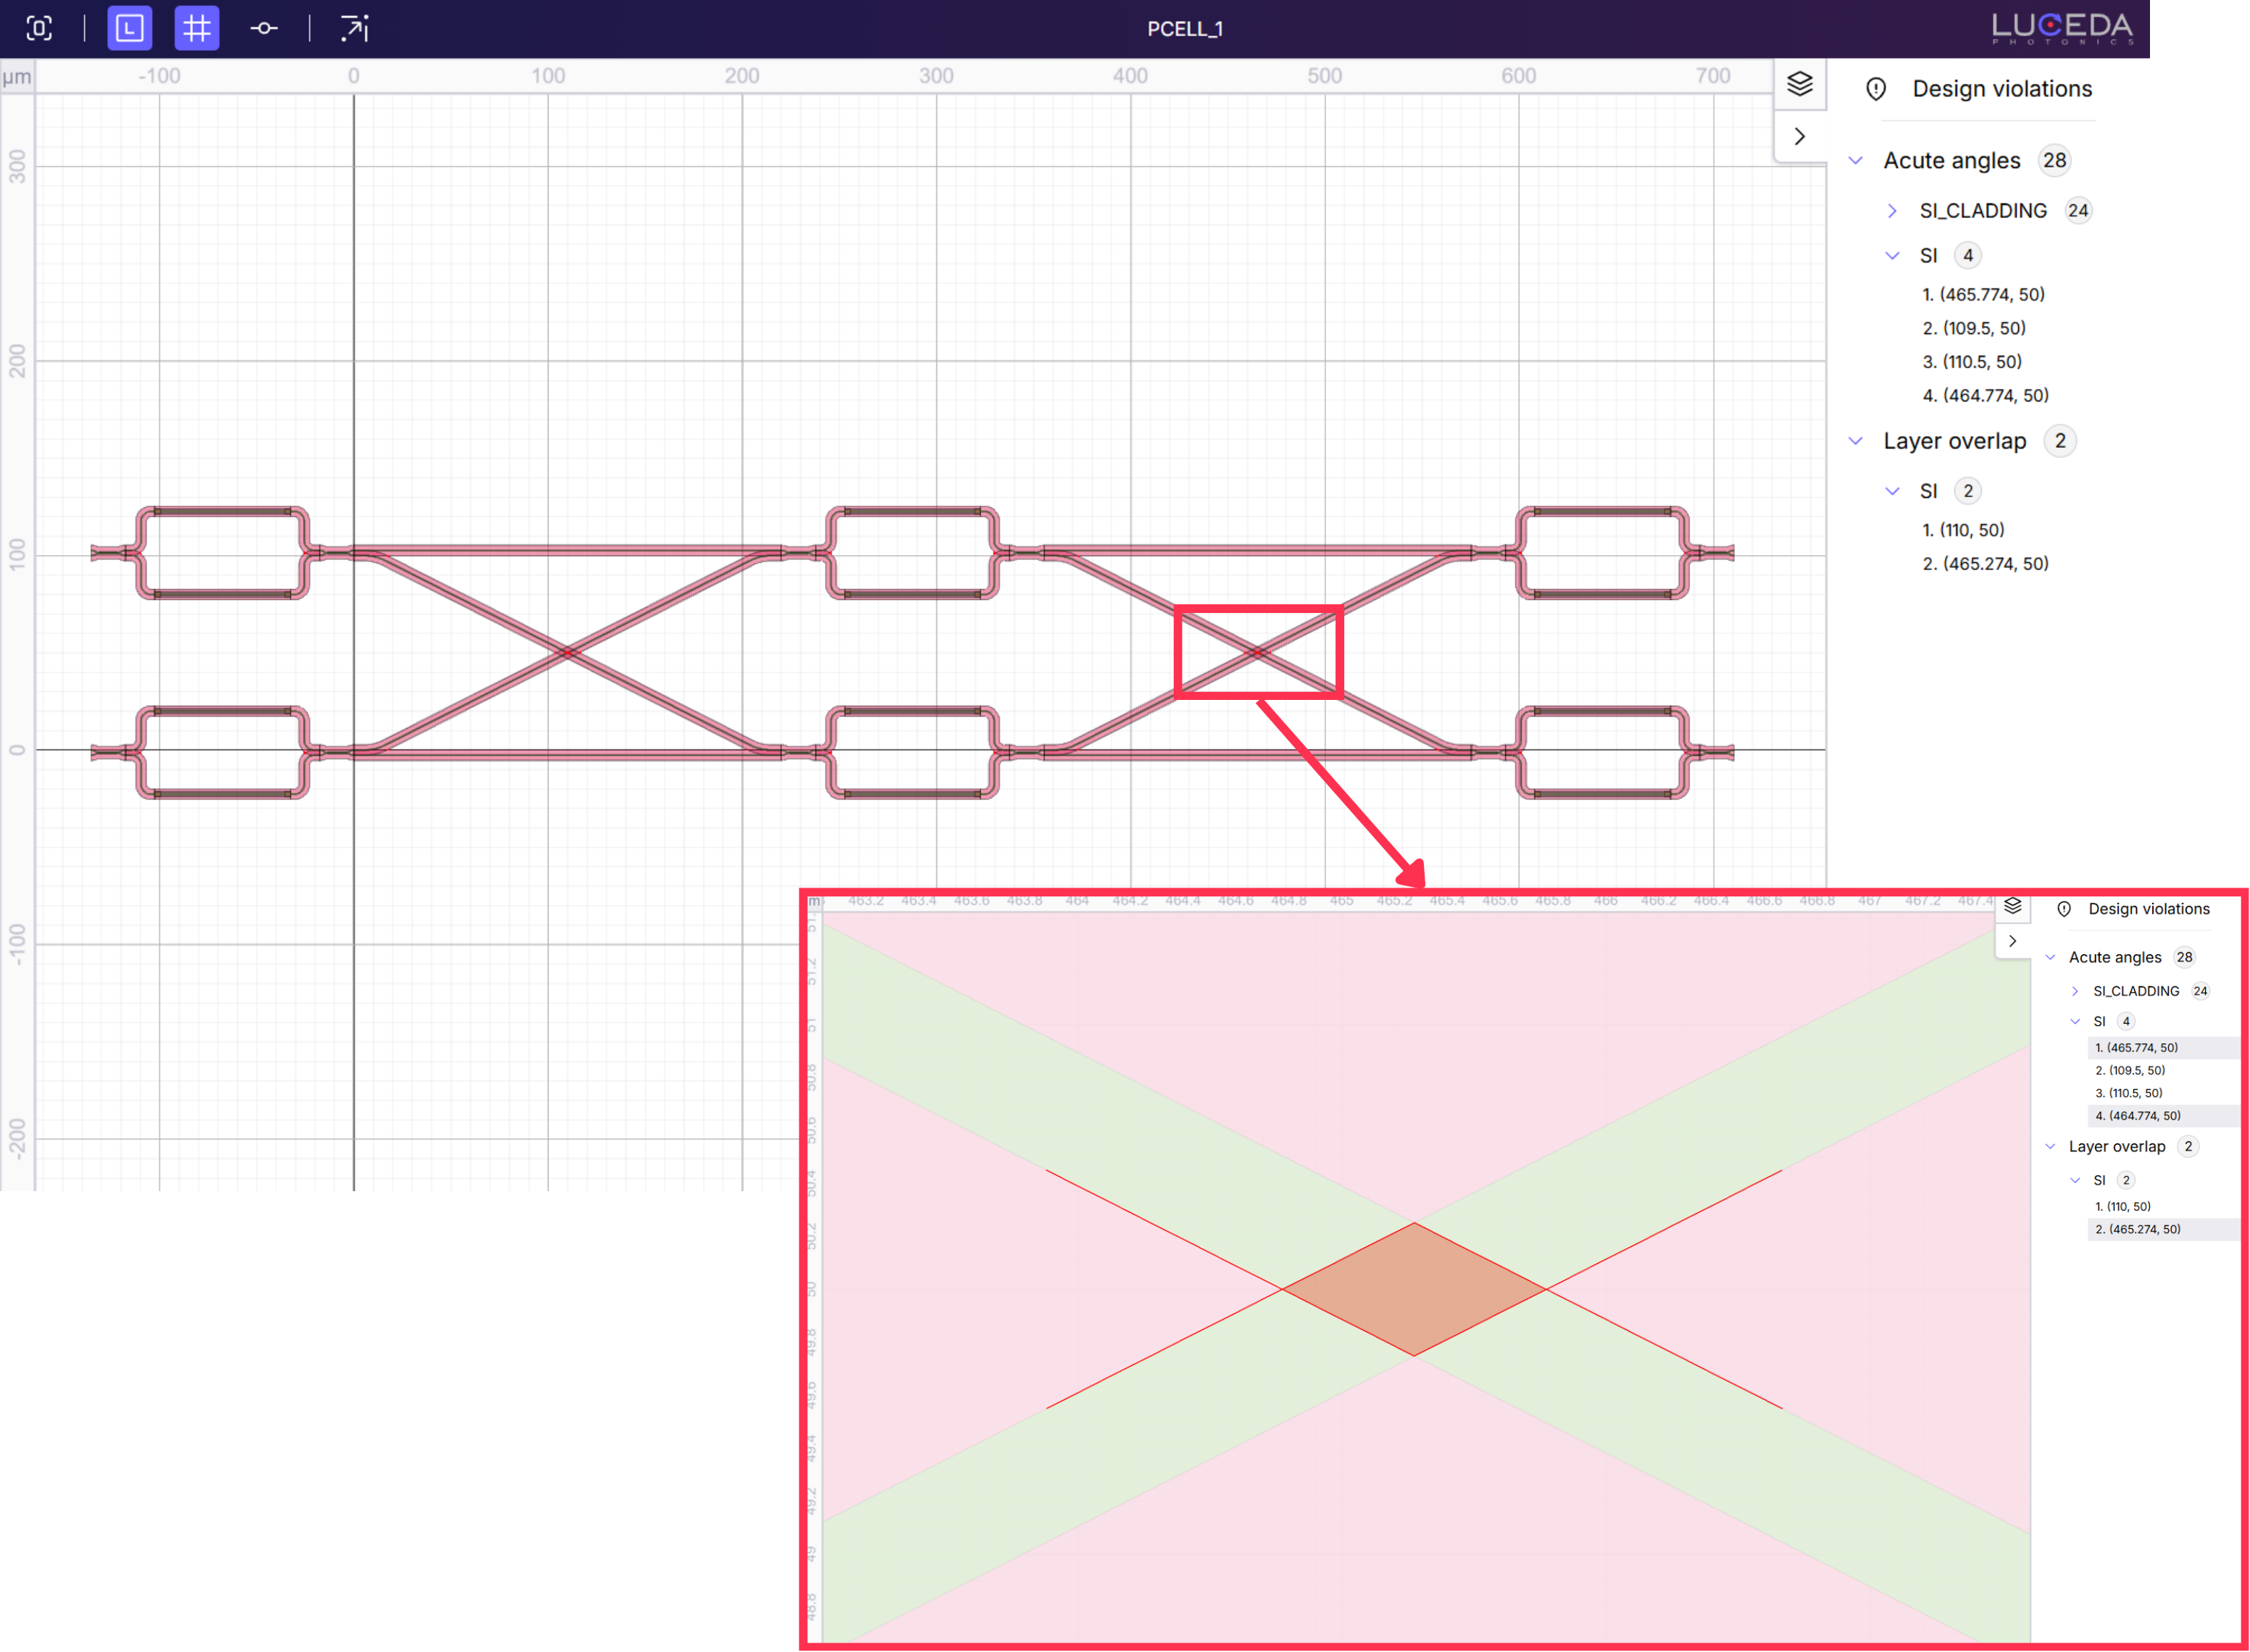
To check for and visualize design violations, you can use the .visualize_violations() method.
This opens your layout and highlights detected design violations, namely acute angles and layer overlaps.
You can customize which violations are checked by passing arguments to the method.
For more details, see visualize_violations.
Using the matplotlib visualizer
To use a different visualizer, such as the earlier visualizer based on matplotlib, you can do so by either:
setting the
engineargument in the.visualize()callsetting the
IPKISS_VISUALIZER_ENGINEenvironment variable
In this case, all parameters of .visualize() can be used to customize the layout appearance.
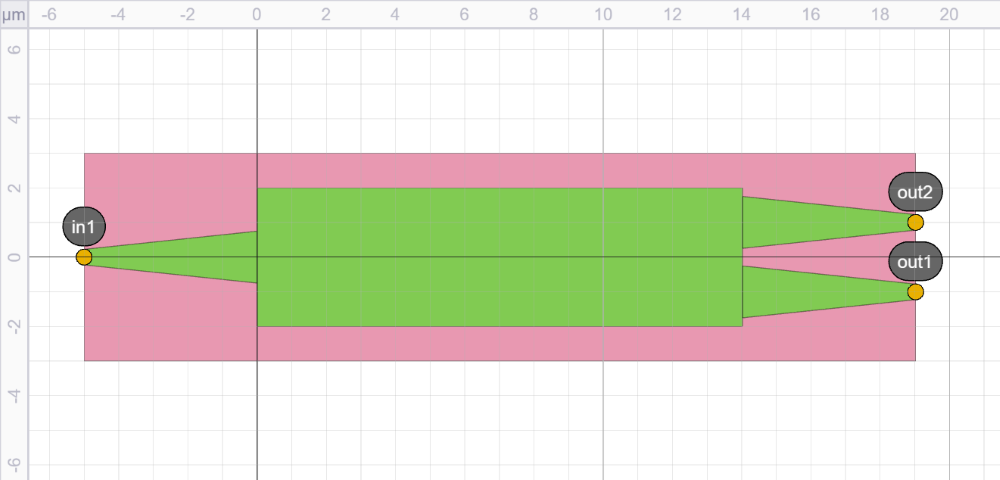
The example below shows how to visualize a layout using matplotlib, with annotations enabled:
import si_fab.all as pdk
import ipkiss3.all as i3

mmi = pdk.MMI1x2Optimized1550()
mmi_layout = mmi.Layout()

mmi_layout.visualize(engine="matplotlib", annotate=True)
visualize
- LayoutView.visualize(canvas_size=None, box=None, show=True, display_styles=<ipkiss3.technology.TechValue object>, default_display_style=None, annotate=False, labels=True, figure=None, legacy=False, grid=True, engine=None, use_experimental_renderer=False)
Visualize a layout.
- NOTE: Except for use_experimental_renderer, none of these parameters
interact with the new Luceda Layout Visualizer.
One can decide to use another visualizer, by following one of two methods.
setting the engine argument in the visualize call
setting the env variable IPKISS_VISUALIZER_ENGINE
Both can receive three values: ‘ipkiss-layout’, ‘matplotlib’, ‘legacy’
- Parameters:
- canvas_size: list
Size of the canvas: [width, height]
- box: list
(deprecated) Box size, [north, east, south, west]
- show: boolean
Show the image, default is True.
- display_styles: DisplayStyleSet
The display style set, default is TECH.DISPLAY.DEFAULT_DISPLAY_STYLE_SET.
- default_display_style: DisplayStyle
The default display style in case a layer is not associated with one, the default is DisplayStyle(alpha=0.4).
- annotate: boolean
Whether to annotate the ports, default is False.
- labels: boolean
Whether to show the labels, default is True.
- figure: Figure
Reuse an existing matplotlib Figure. By default, a new Figure will be created.
- legacy: boolean
(deprecated, use engine instead) Use the legacy version of visualize
- grid: boolean
Show the gridlines, default is True.
- engine: EngineType | None
Decide which engine the visualizer uses. See the NOTE in this docstring.
- use_experimental_renderer: boolean
Use the new experimental renderer in the Luceda Layout Visualizer. Not all functionality of the original renderer is supported yet, but it has massively improved performance and it can load larger layouts.
- Returns:
- None, if applicable a matplotlib Figure.
visualize_violations
- LayoutView.visualize_violations(acute_angle_threshold=0.0, acute_angle_layers=None, overlap_layers=None)
Detects and visualizes DRC violations on the Layout.
Supported violations are acute angles and layer overlaps.
- Parameters:
- acute_angle_threshold: float, optional
The threshold for acute angle. Default is 0.0.
- acute_angle_layers: list[PPLayer], optional
List of layers to inspect acute angles. If not provided, all layers are inspected. Empty list ([]) disables the acute angles check.
- overlap_layers: list[PPLayer], optional
List of layers to inspect layer overlaps. If not provided, all layers are inspected. Empty list ([]) disables the layer overlaps check.
- Returns:
- None