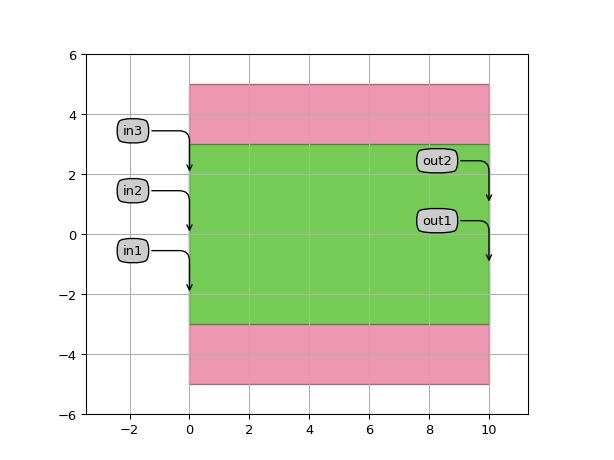
MMIIdentical
- class picazzo3.filters.mmi.cell.MMIIdentical
Rectangular multimode interferometer, generated from a trace template with identical input and output trace_templates.
- Parameters:
- output_trace_template: PCell
Output trace template.
- input_trace_template: PCell
Input trace template.
- mmi_trace_template: PCell and _WaveguideTemplate
Trace template used for the MMI section
- n_outputs: int and number > 0
Number of output channels.
- n_inputs: int and number > 0
Number of input channels
- name: String that contains only ISO/IEC 8859-1 (extended ASCII py3) or pure ASCII (py2) characters
The unique name of the pcell
- Other Parameters:
- mmi_trace: PCell, locked
Trace of the MMI section
- output_trace_templates: List with type restriction, allowed types: <class ‘ipkiss3.pcell.cell.pcell.PCell’>, locked
List of the output trace templates.
- input_trace_templates: List with type restriction, allowed types: <class ‘ipkiss3.pcell.cell.pcell.PCell’>, locked
List of the input trace templates.
Views
- class Layout
- Parameters:
- length: float and number > 0
Length of the MMI
- output_y_positions: list<int, float, integer, floating>
Positions in the y direction at the output where ports are be added
- input_y_positions: list<int, float, integer, floating>
Positions in the y direction at the input where ports are be added
- view_name: String that contains only alphanumeric characters from the ASCII set or contains _$. ASCII set is extended on PY3.
The name of the view
Examples
import si_fab.all as pdk  # noqa: F401
from picazzo3.filters.mmi.cell import MMIIdentical
from picazzo3.traces.wire_wg.trace import WireWaveguideTemplate
import ipkiss3.all as i3

mmi_trace_template = WireWaveguideTemplate()
mmi_trace_template.Layout(core_width=6.0, cladding_width=10.0)
MMI = MMIIdentical(
    mmi_trace_template=mmi_trace_template,
    input_trace_template=i3.TECH.PCELLS.WG.DEFAULT,
    output_trace_template=i3.TECH.PCELLS.WG.DEFAULT,
    n_inputs=3,
    n_outputs=2,
)
layout = MMI.Layout(length=10.0, input_y_positions=[-2.0, 0.0, 2.0], output_y_positions=[-1.0, 1.0])
layout.visualize(annotate=True)
