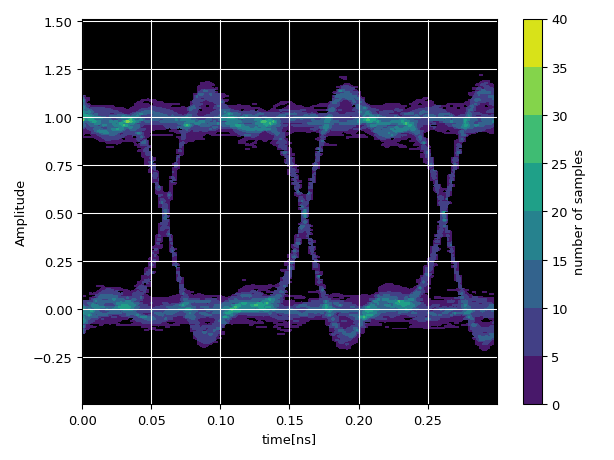
EyeDiagram
- class ipkiss3.all.EyeDiagram
Object representing a signal eyediagram
- Parameters:
- data_stream: array_like
input 1-D data samples
- baud_rate: float
symbols per second of input signal
- time_step: float
time between two adjacent samples(unit:second)
- offset: float
the transformation proportion of the analysis window. Defaults to 0. the value should be within [0,1]
- resampling_rate: float
resampling rate for processing original data stream. Defaults to 1. if resampling_rate is 2, the original data will be upsampled. The size of data will be doubled. if resampling_rate is 0.5, the original data will be downsampled. The size of data will be reduced to half.
- n_eyes: int
number of complete eyes shown in the figure. Defaults to 1
- visualize(show=True, title=None, x_grids=None, y_grids=200, extend_y=0.05, figure=None)
Visualize the signal eyediagram.
- Parameters:
- show: bool
- title: str or None
title of the figure
- x_grids: int or None
Number of grids for x-axis of visualization
- y_grids: int
Number of grids for y-axis of visualization. Defaults to 200.
- extend_y: float
extend the y-axis of the eyediagram figure the value should be within [0,1]. Defaults to 0.05.
Notes
x_grids and y_grids will only affect visualization, which means original data is not processed by setting these two parameters. Larger grids will lead to more scattered distribution of data in the final figure
Examples
import numpy as np
from scipy.signal import ellip, lfilter
from ipkiss3 import all as i3

# Copyright (c) 2015, Warren Weckesser.  All rights reserved.
def demo_data(num_symbols, samples_per_symbol):
    # A random stream of "symbols" (i.e. bits)
    bits = np.random.randint(0, 2, size=num_symbols)

    # Upsample the bit stream.
    sig = np.repeat(bits, samples_per_symbol)

    # Convert the edges of the symbols to ramps.
    r = min(5, samples_per_symbol // 2)
    sig = np.convolve(sig, [1.0 / r] * r, mode="same")

    # Add some noise and pass the signal through a lowpass filter.
    b, a = ellip(4, 0.087, 30, 0.15)
    y = lfilter(b, a, sig + 0.075 * np.random.randn(len(sig)))

    return y

num_symbols = 1000
samples_per_symbol = 20
y = demo_data(num_symbols, samples_per_symbol)

baud_rate = 10e9
time_step = 1.0 / (baud_rate * samples_per_symbol)
eye = i3.EyeDiagram(y, baud_rate=baud_rate, time_step=time_step, resampling_rate=2, offset=0.2, n_eyes=2)
eye.visualize(extend_y=0.2)
